Exploring Job Satisfaction Across the United States
Job satisfaction isn't one-size-fits-all. For many, a job simply pays the bills, while others find genuine fulfillment in their daily work. Beyond personal passions, factors such as industry, compensation, and work schedules all play significant roles in shaping how content employees feel in their roles.
To dive deeper into these trends, a comprehensive survey asked individuals across the country to rate their job satisfaction on a scale from 0 to 5. This information provided a national baseline and allowed for in-depth comparisons across states, industries, and age groups. Details about the methodology are shared later in the article, but first, let’s explore the key findings.
How Does Job Satisfaction Vary by State?
When analyzing responses from across the U.S., the average job satisfaction score came in at 3.3 out of 5. This places most Americans in the “my job is OK” range, suggesting moderate satisfaction levels overall. However, job fulfillment levels differ notably from state to state.
(Click the image below for an expanded view)
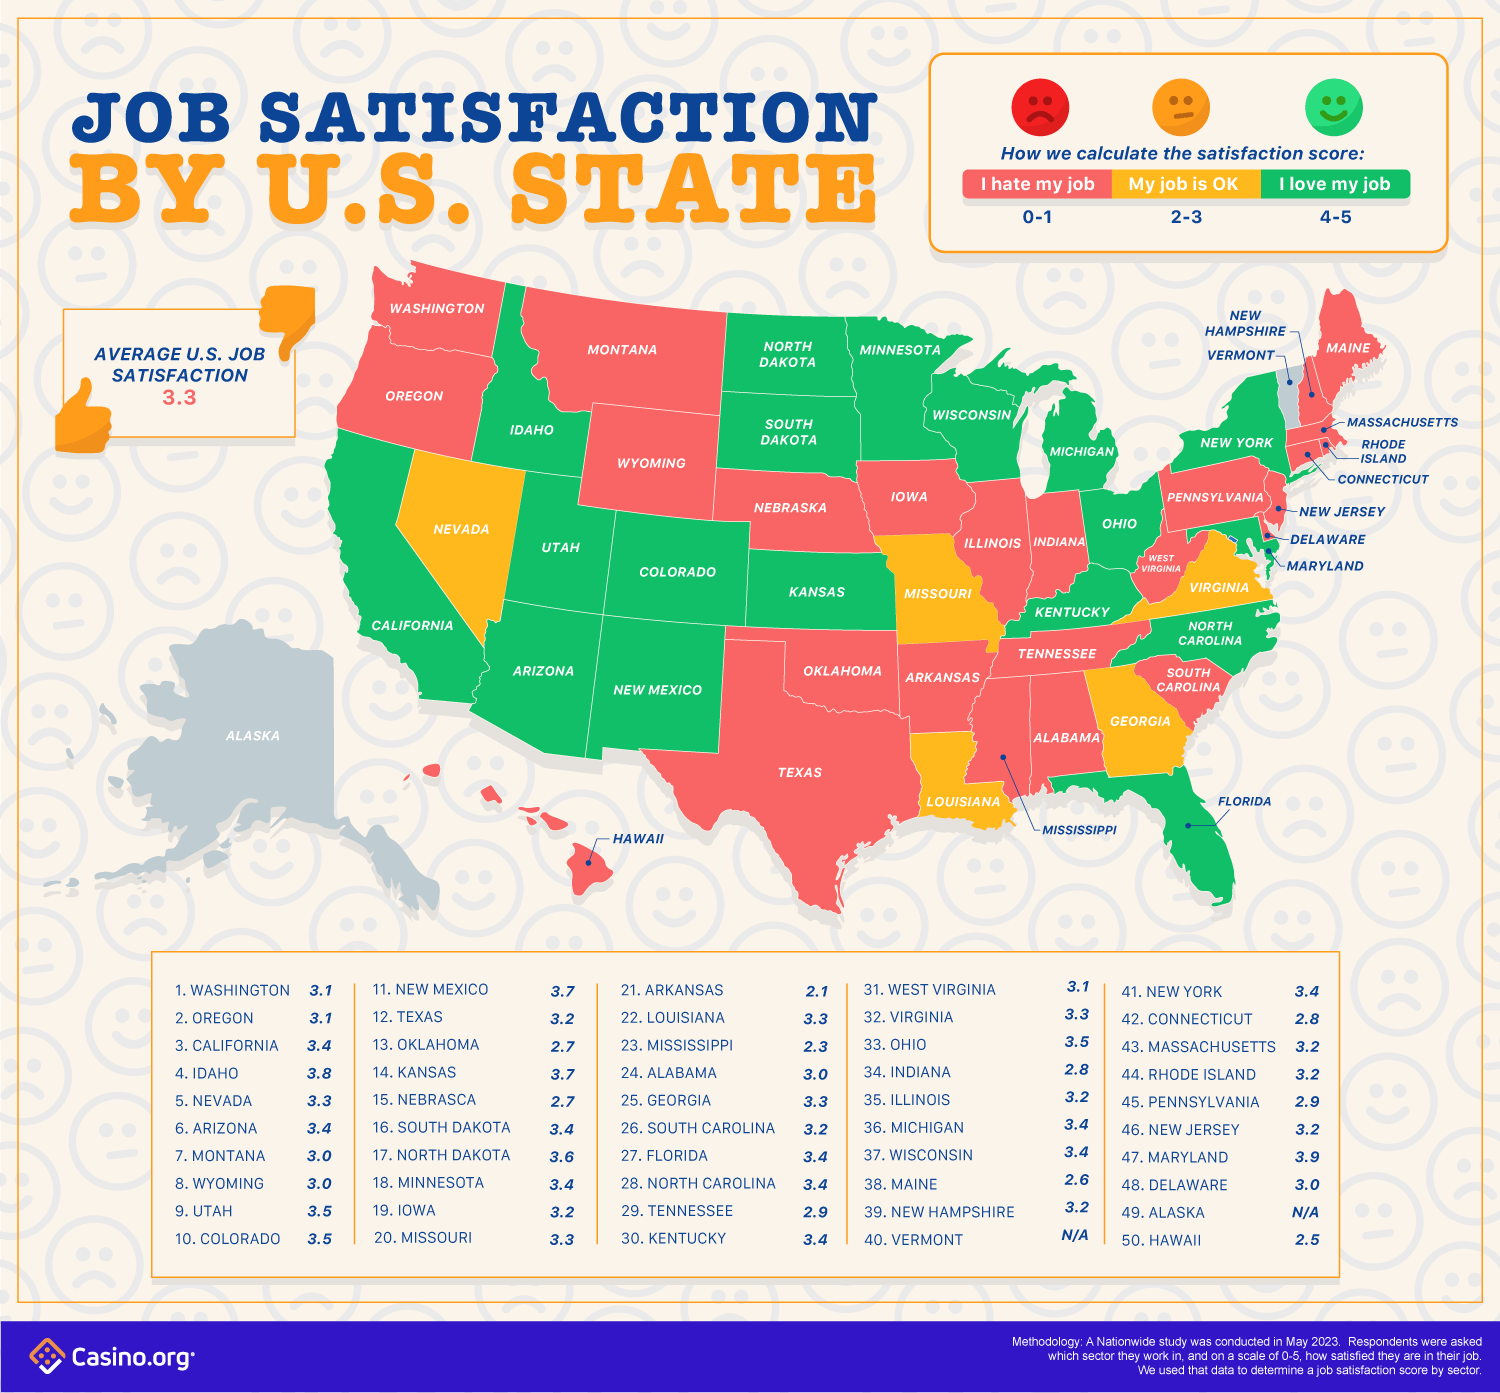
Job satisfaction by state
Several states reported significantly lower satisfaction scores, falling below the national benchmark of 3.3. Notably:
- Arkansas (2.1)
- Mississippi (2.3)
- Hawaii (2.5)
- Maine (2.6)
- Oklahoma (2.7)
- Nebraska (2.7)
- Indiana (2.8)
- Pennsylvania (2.9)
Conversely, certain regions fare much better. States where people are markedly happier with their work include:
- Maryland (3.9)
- Idaho (3.8)
- New Mexico (3.7)
- North Dakota (3.6)
- Utah (3.5)
- Ohio (3.5)
Other states that exceed the national average-though by a slimmer margin-are California, Florida, New York, and Michigan, each at 3.4. States like Nevada, Missouri, Louisiana, Georgia, and Virginia align exactly with the national average at 3.3.
Workplace Happiness by Industry Sector
Job satisfaction isn’t just a matter of geography; it also varies widely by profession.
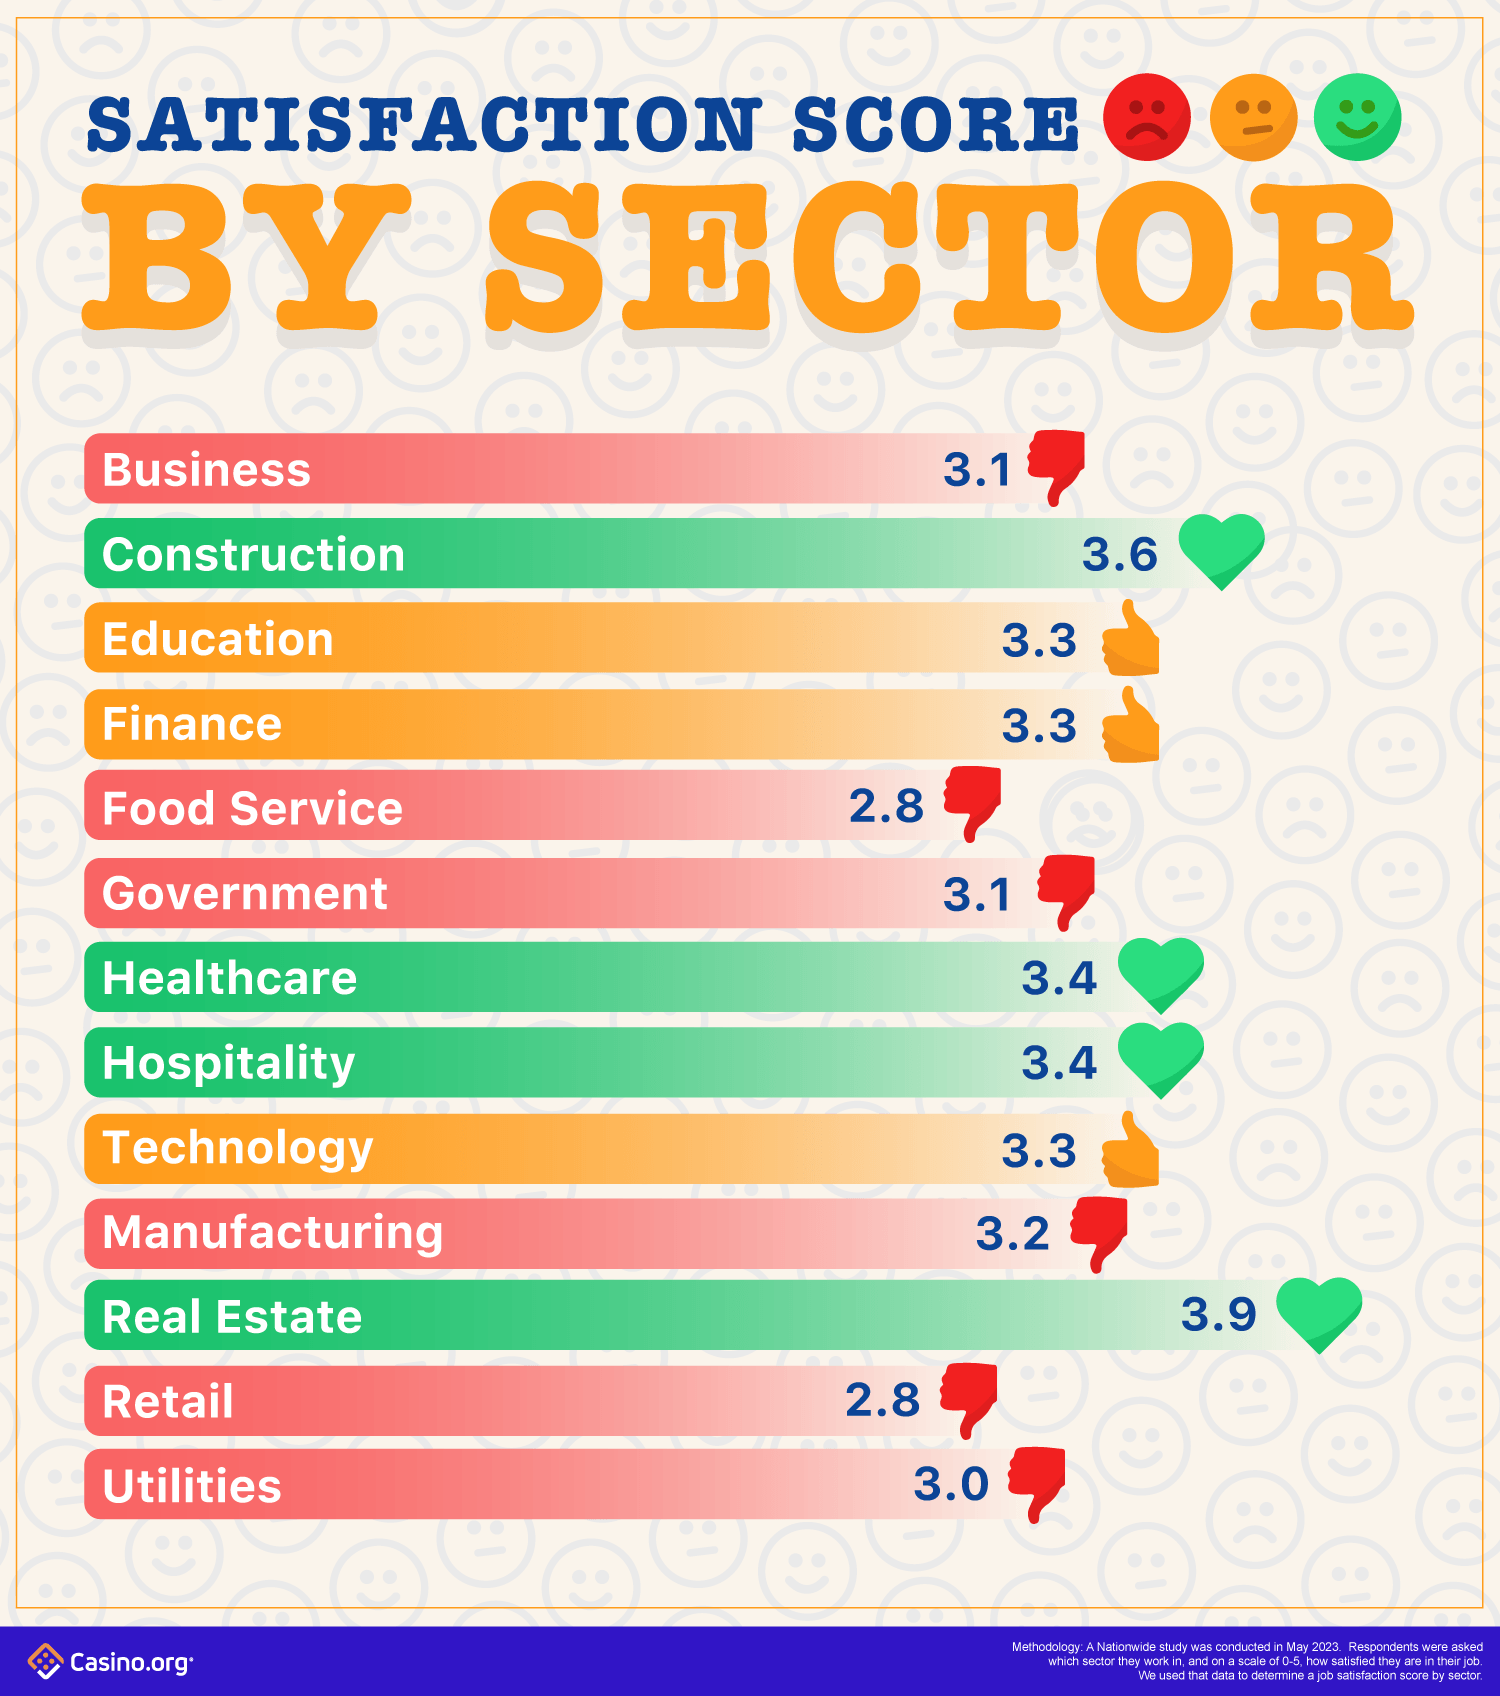
Satisfaction score by sector
Those in real estate lead the pack with an average satisfaction score of 3.9 out of 5. Construction employees also express strong contentment, averaging 3.6. Healthcare and hospitality are the only other sectors to exceed the nationwide mean.
On the opposite end, employees in food service and retail both average just 2.8, highlighting substantial room for improvement in those fields. Several other industries, such as utilities (3.0), government (3.1), business (3.1), and manufacturing (3.2), hover just below or slightly above the national baseline, indicating a broader spread in day-to-day workplace happiness.
Job Satisfaction Across Generations
Age, and by extension generational experience, also influences workplace fulfillment.
- Generation Z (born 1997-2012) ranks lowest, with an average satisfaction of 3.1.
- Millennials (born 1981-1996) aren’t far ahead, with a score of 3.2.
- Baby Boomers (born 1946-1964) align with the national average at 3.3.
- Generation X (born 1965-1980) stands out as the most content, reporting a slightly higher score of 3.4.
This generational spread suggests that work outlook and expectations may shift with age and career stage, with middle-aged professionals tending to report more positive workplace experiences.
Survey Design and Data Collection
To gain these insights, a national survey was conducted in May 2023. Participants, aged 18 to 65 and living throughout the United States, were asked several key questions:
- Which state do you live in?
- Which age group do you belong to?
- What sector do you work in?
- How would you rate your job satisfaction?
Job satisfaction was measured on a scale of 0 to 5, broken down as follows:
- 0-1: “I hate my job”
- 2-3: “My job is OK”
- 4-5: “I love my job”
The national average was calculated from all survey responses. Results were then segmented to compare satisfaction by state, sector, and generation.
Note: The color coding in the infographic maps visually displays whether a state is above or below the national average for job satisfaction.
Sharing This Research
Anyone is welcome to reference or republish data and images from this report. Please attribute the source accordingly. For any media inquiries or further information about these findings, contact the research team as needed.