The True Cost of Being a Sports Fan: How Much Spectators Spend at Major Events
Sports fandom goes beyond pure passion-it’s big business. The North American sports market alone is valued at a staggering $83.1 billion, and with the arrival of Formula One alongside traditional powerhouses like the NFL, MLB, and NBA, competition for fans’ hearts and wallets is fiercer than ever. As the calendar fills with high-profile matchups-the NBA Finals, Stanley Cup, Olympics, and more-millions contemplate not just which event to watch, but how much they’re willing to pay for the ultimate experience.
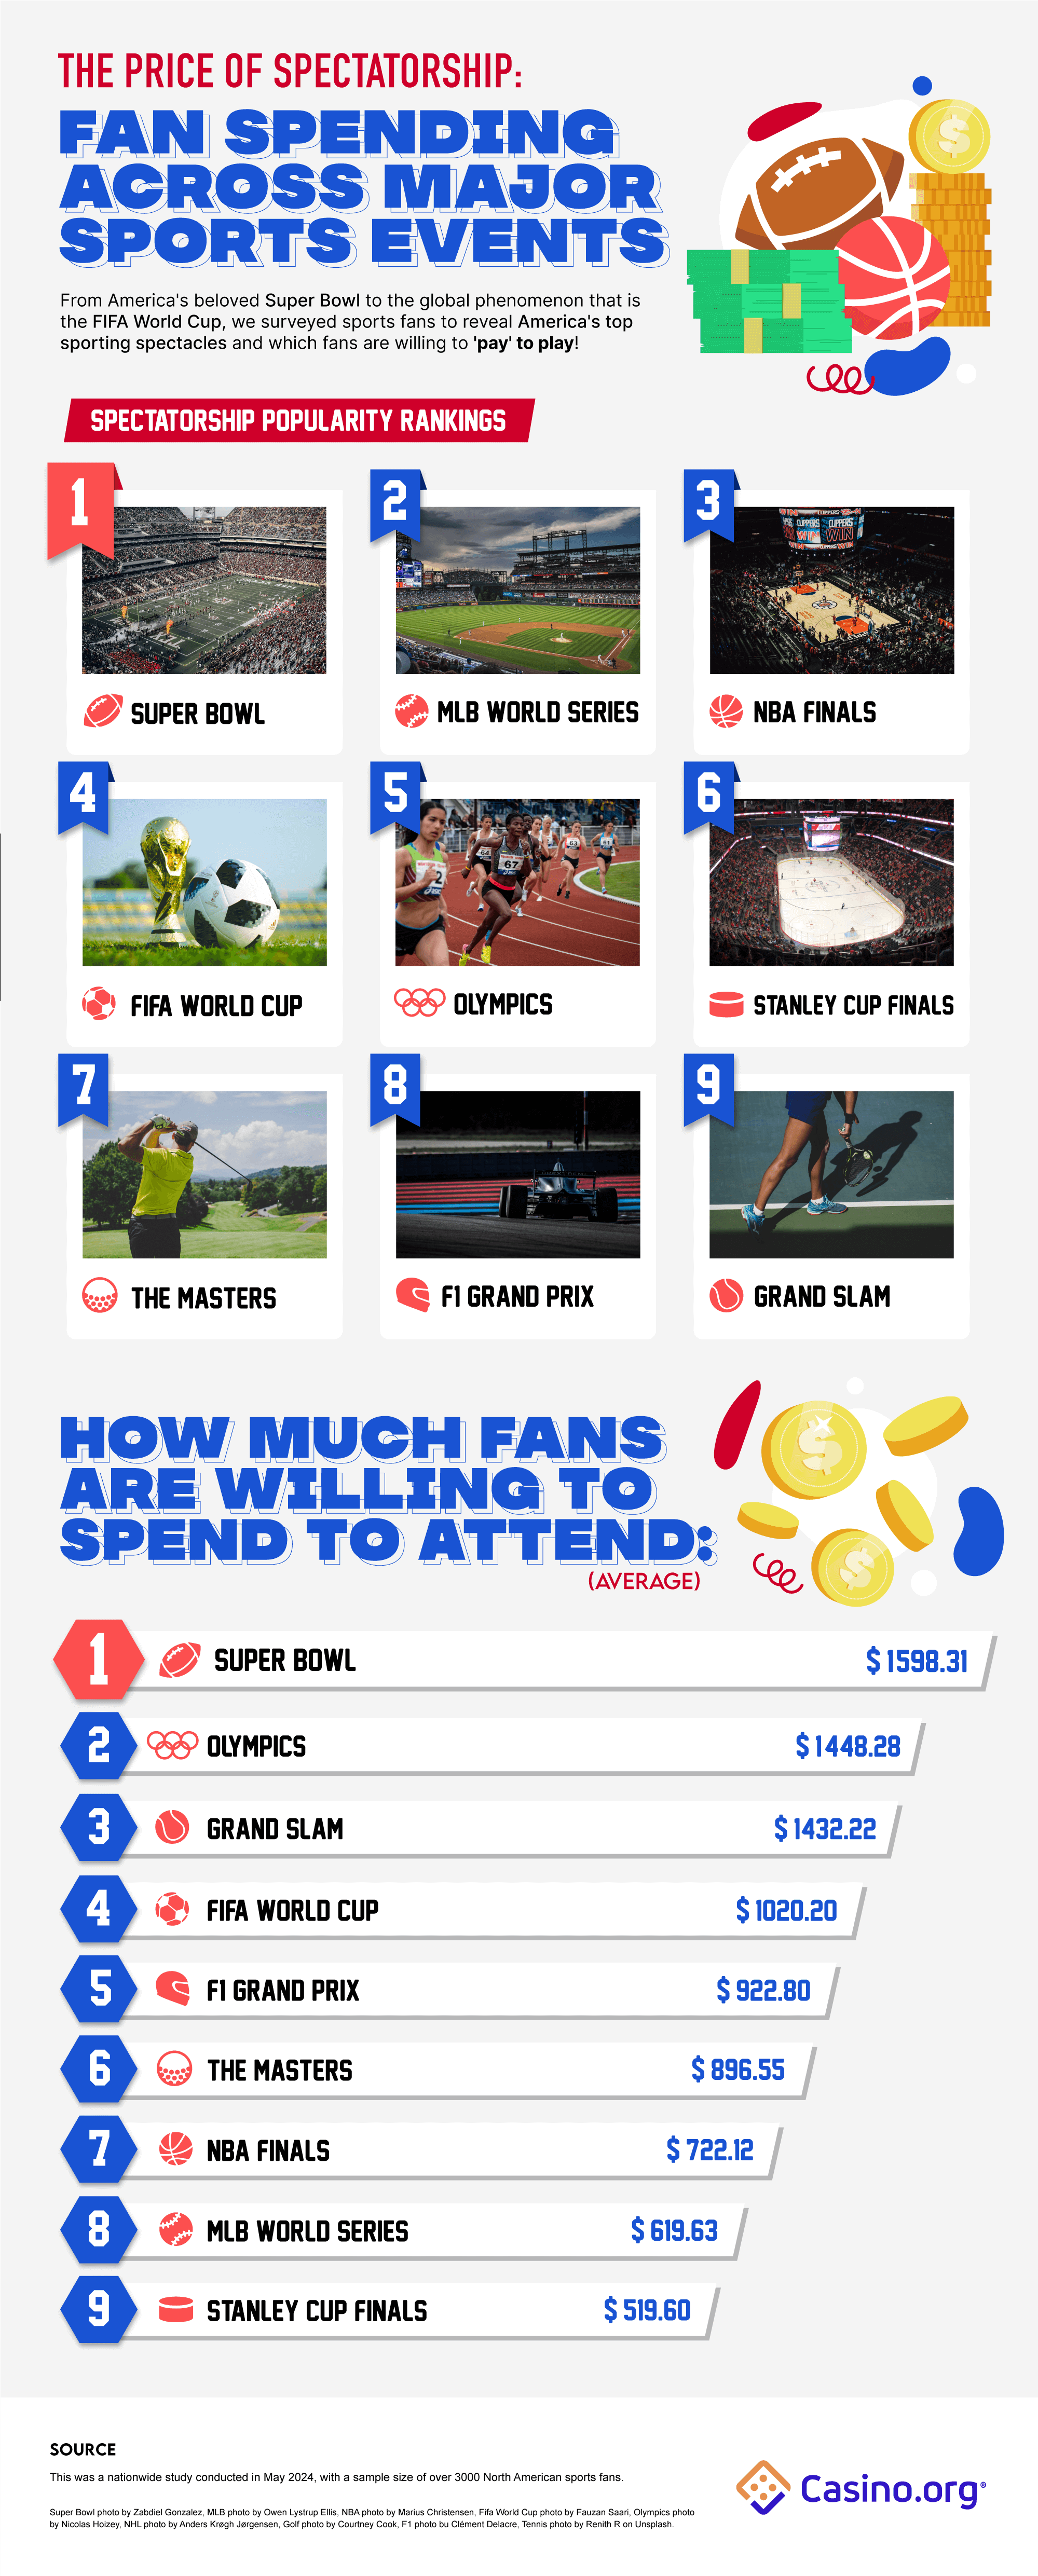
To understand the financial side of fandom, a survey of more than 3,000 North American sports fans reveals which championships are most in demand and how much spectators are prepared to invest for a seat at these iconic showdowns.
Survey Highlights: Insights into Fan Preferences and Spending
- The Super Bowl comes out on top as the most coveted and costly event for spectators, with fans willing to spend an average of $1,598.31.
- The MLB World Series follows as the second-most desired event, with the NBA Finals ranking third in popularity.
- When it comes to ticket budgets, the Olympics inspire major spending-fans are ready to pay an average of $1,448.28.
- Despite its prestige, the NBA Finals is the priciest championship for fans, while the FIFA World Cup is relatively affordable in comparison.
Which Major Sports Events Capture the Most Attention?
Infographic: US Major Sports Events by Popularity and Cost.
Among North American fans, the Super Bowl is the top ticket-garnering 34% of the vote as the must-attend sporting event. The 2023 broadcast drew over 100 million US television viewers, with a record-breaking 123.7 million tuning in for the most recent championship. In Canada, 19 million watched-nearly half the population. Clearly, the Super Bowl is more than a game; it’s a shared cultural event that shapes national identity.
Baseball’s MLB World Series secures second place. Generations of fans flock to this time-honored American tradition, drawn by both nostalgia and the game’s enduring appeal. For many, experiencing the World Series in person is a lifelong dream.
In third place is the NBA Finals, which continues to captivate fans with show-stopping action. The playoffs average 5.4 million viewers per game, surging to 12 million for the championship matchup. The blend of energy and drama means tickets are in high demand each year.
The remaining rankings for sought-after events are:
- FIFA World Cup (4th)
- Olympics (5th)
- Stanley Cup Finals (6th)
- The Masters (7th)
- Formula One Grand Prix (8th)
- Tennis Grand Slam events (9th)
Willingness to Pay: How Much Are Fans Prepared to Spend on Tickets?
The financial commitment to attend major sporting events is significant-and fans know it. For the Super Bowl, surveyed fans report they could part with an average of $1,598.31 for a ticket. Yet, in reality, this sum is just 18.9% of the most recent average ticket price of $8,600, underscoring the steep hurdle for many hopefuls.
Enthusiasm for the 2024 Summer Olympics is equally impressive. Fans would pay up to $1,448.28 on average for Olympic tickets (excluding travel costs), making it the second priciest event for spectators. Ticket prices vary widely depending on the sport-for example, finals in swimming or gymnastics can exceed $1,000, while early rounds in sports like handball may be under $300. Regardless, fans are eager to invest to witness historic moments live.
Another surprising outcome: Grand Slam tennis events are third in terms of fan ticket budgets, with attendees prepared to pay $1,432.22 on average. Taking the US Open as an example, tickets for the Women’s Finals start at $755, while the Men’s Finals begin at $2,220; courtside seats command significantly higher prices.
Here’s a summary of the average amounts fans are willing to pay for premier events:
| Event | Average Willingness to Pay (USD) |
|---|---|
| Super Bowl | $1,598.31 |
| Olympics | $1,448.28 |
| Grand Slam (Tennis) | $1,432.22 |
| FIFA World Cup | $1,020.20 |
| Formula One Grand Prix | $911.47 |
| The Masters | $869.78 |
| NBA Finals | $722.12 |
| MLB World Series | $687.81 |
| Stanley Cup Finals | $579.57 |
Event Affordability: Which Experiences Are Within Reach?
To understand the gap between fan willingness and the cold reality of ticket prices, we compared surveyed “willing to pay” figures with actual average ticket costs for each event. This comparison reveals which events offer the most accessible experiences for fans and which are prohibitively expensive.
Here’s how each event stacks up:
| Event | % of Ticket Price Fans Willing to Pay | Notes |
|---|---|---|
| FIFA World Cup | 119% | Fans willing to pay more than average ticket price ($1,020.20 vs. $855) |
| Olympics | 93.5% | Close to parity with average ticket price |
| The Masters | 54.6% | Willingness covers half typical ticket costs |
| Stanley Cup Finals | 49% | Less than half of actual ticket price |
| Grand Slam (Tennis) | 43% | Considerably less than required for top seats |
| MLB World Series | 39.1% | Most fans can’t meet the market rate |
| Formula One Grand Prix | 30.4% | Ticket prices far exceed fan budgets |
| Super Bowl | 18.9% | Huge gap between willingness and price |
| NBA Finals | 11.9% | Least affordable by survey data |
The FIFA World Cup stands out as the most affordable, with fans actually willing to pay above the ticket average. By contrast, the NBA Finals is the hardest on the wallet-fans’ average willingness to pay covers just a small fraction of the typical ticket price ($722.12 versus $6,080.52 in 2023).
Key Takeaways: Balancing Passion and Practicality
Being a dedicated fan comes with a price-sometimes a steep one. While the thrill of live sports is unmatched, budget realities mean that most fans must make tough choices: seek out less expensive seating, opt for early-round matches, or enjoy the excitement from the comfort of home. Still, for the most passionate among us, the dream of attending a major championship in person endures.
About the Survey
This analysis is based on responses from 3,000 North American sports fans surveyed in May 2024. The average participant age was 40.8 years. Gender representation among respondents was: 75.1% male, 24.2% female, 0.4% non-binary, and 0.3% transgender.
All financial figures referenced are in USD.
Usage Guidelines
Data, tables, and visual elements from this page may be shared for non-commercial purposes, provided proper credit and a link back to the original content are included. For further press inquiries, please contact the author via the appropriate channels.