Valentine’s Day and America’s Most Cherished Love Languages
Valentine’s Day brings a surge of romance across the United States, as couples prepare to celebrate in unique ways. From the classic exchange of chocolates and flowers to heartfelt notes and special meals, expressions of love take center stage. But how exactly do Americans prefer to show and receive affection during this special holiday? To gain insight, a recent survey of 3,000 U.S. residents explored the most valued love languages in each state.
Key Insights Into America’s Love Language Trends
A nationwide look at love language preferences revealed several fascinating trends:
– “Acts of service” emerged as the leading way Americans express love, chosen as the top form of affection in 33 states.
– When it comes to receiving love, “quality time” holds the top spot, favored by 27% of those surveyed.
– Across all generations, genders, and states, “receiving gifts” ranked lowest among the five love languages.
Which Expressions of Love Dominate Across the States?
The classic five love languages—acts of service, quality time, physical touch, words of affirmation, and gifts—were put to the test, revealing regional preferences for how love is most often shown.
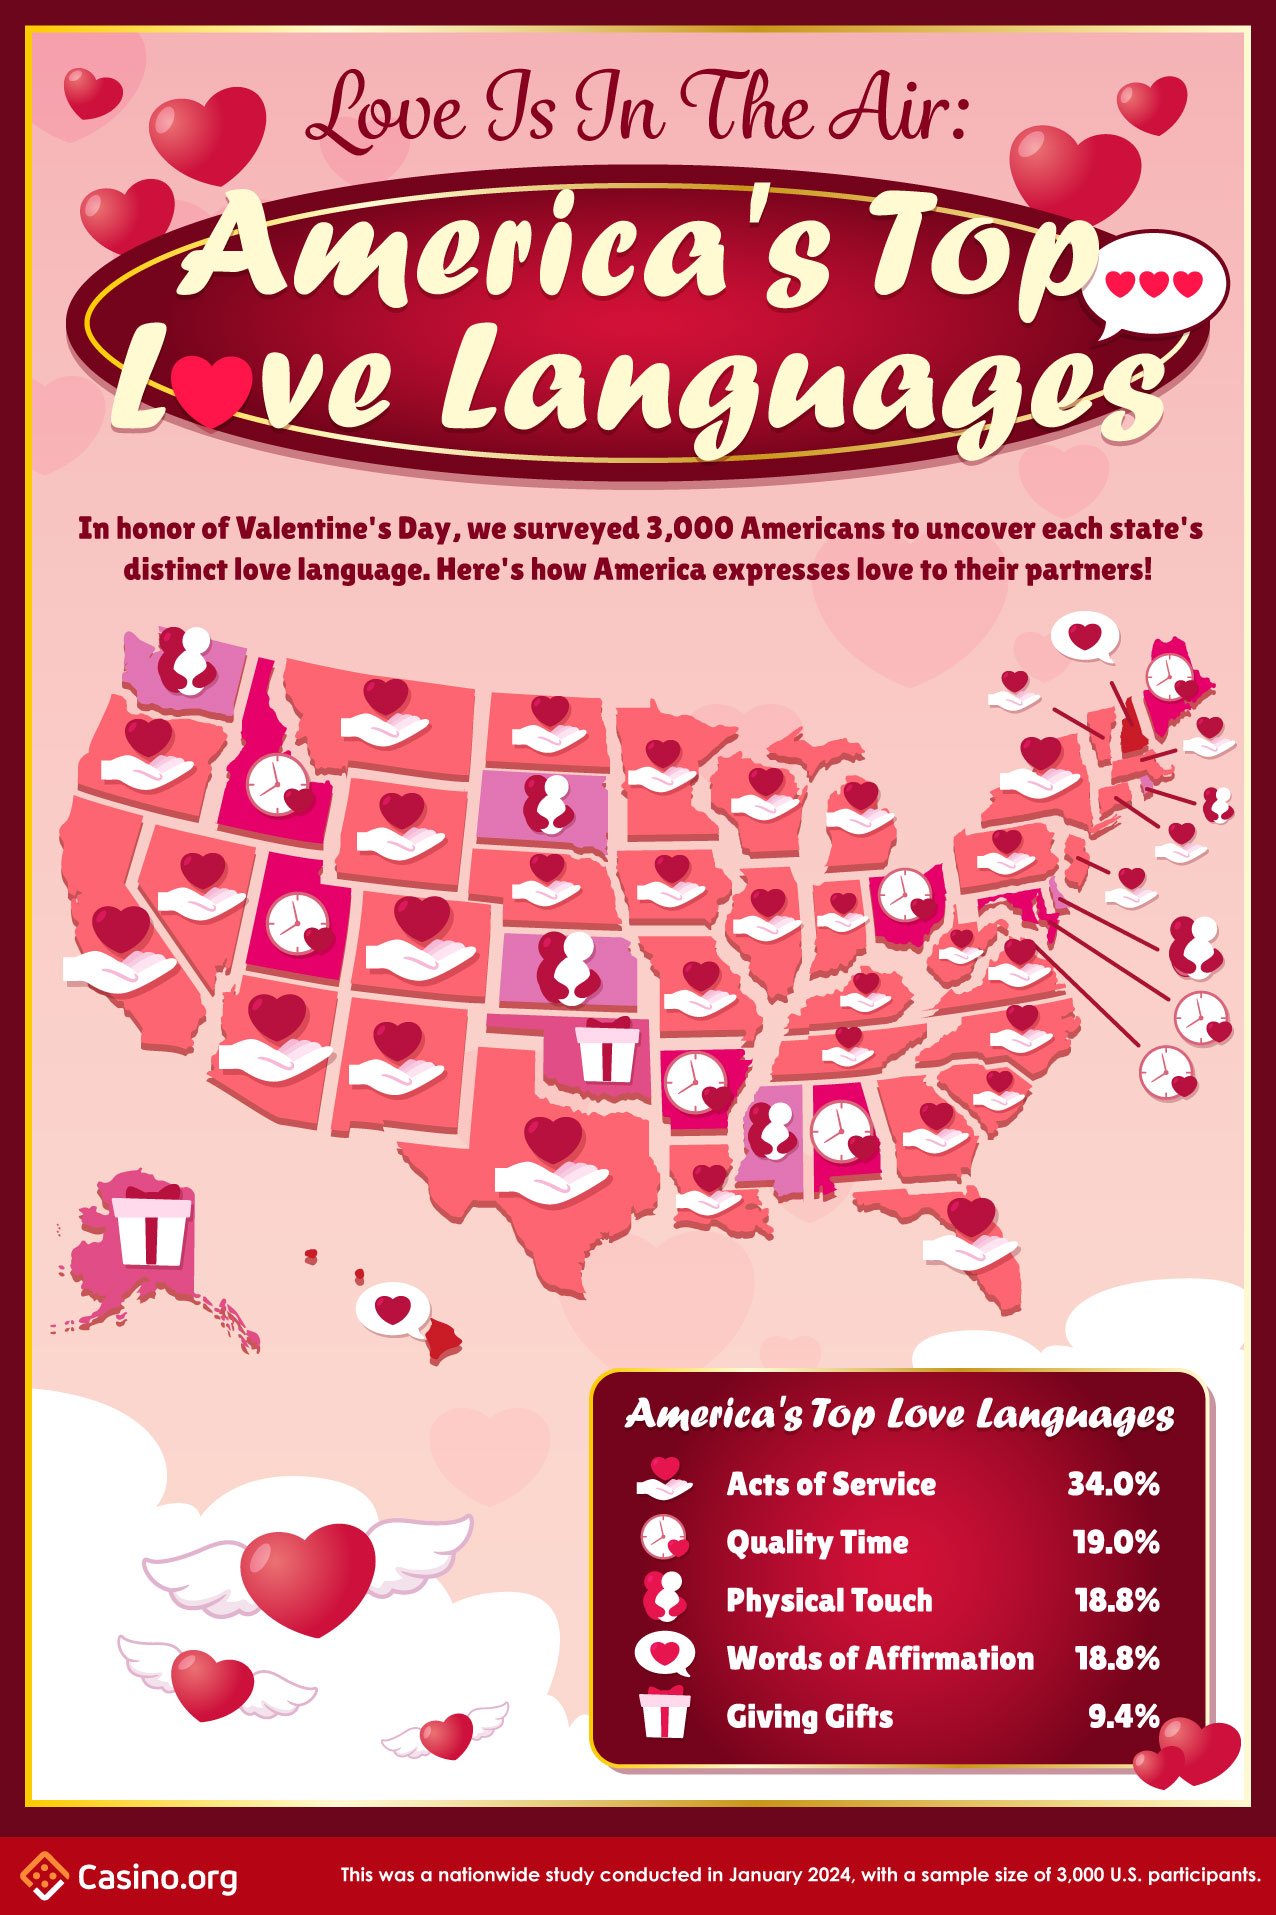
Acts of service leads as the nation’s most popular way to express love, chosen by respondents in 33 states. Whether it’s making a partner’s favorite snack, taking on household chores, or surprising them with their morning coffee, Americans are leaning into thoughtful gestures this Valentine’s Day.
Eight states—including Alabama, Arkansas, D.C., Idaho, Maine, Maryland, Ohio, and Utah—prefer quality time. For these states, Valentine’s Day is all about carving out moments to enjoy together, be it through romantic dinners or shared adventures.
Behaviors such as physical touch and offering words of affirmation are equally important to many. Both were chosen by approximately 18.8% of respondents, tied for third place. Some favor warm embraces or snuggling with a favorite film, while others find meaning in heartfelt, handwritten notes.
At the bottom of the list, “giving gifts” was cited as a preferred love language by only 9.4% of Americans. Despite being less popular, the sentiment behind gift-giving remains profound for those who embrace it—especially in states like Alaska and Oklahoma, where exchanging presents takes on heightened importance.
Preferred Ways to Receive Love Across America
The survey also examined how individuals prefer to be loved. Respondents were asked, “What’s your favorite love language to receive from your partner?”
Quality time topped the list as the most valued love language to receive, with 27% identifying it as their favorite. Americans clearly treasure moments of dedicated togetherness. Physical touch closely followed at 25%, while acts of service ranked third at 22%. Words of affirmation trailed at 20%, and, consistent with earlier findings, receiving gifts was chosen by just 6%.
Here’s a breakdown:
| Love Language (Receiving) | Percentage of Respondents |
|---|---|
| Quality Time | 27% |
| Physical Touch | 25% |
| Acts of Service | 22% |
| Words of Affirmation | 20% |
| Receiving Gifts | 6% |
Noteworthy Differences by Gender and Age Group
Love language preferences show some fascinating variances across genders and generations. For all gender groups—including female, male, non-binary, and transgender—acts of service is the leading love language to express. This consistency suggests that meaningful action speaks loudly to Americans, regardless of identity.
Generationally, Gen Z, Millennials, and Gen X overwhelmingly opt for quality time as the best way to show affection. Meanwhile, Baby Boomers differ somewhat, with physical touch emerging as their most favored love language. Whether it’s a warm embrace or shared laughter, older couples tend to appreciate closeness as a primary symbol of love.
Celebrating Love in Diverse Ways
This survey reinforces one core truth: love is personal, diverse, and dynamic. Whether crafted through quality time, helpful actions, affectionate words, or thoughtful gestures, Americans use the five love languages in vibrant and individualized ways. If you’re aiming to show your appreciation this Valentine’s Day, let these insights guide you toward a more meaningful celebration—the language of love is as varied as it is heartfelt.
Survey Methodology
The data presented stems from a nationwide survey conducted in January 2024, involving 3,000 participants from across the United States. The average age of respondents was 38.9 years. The demographic breakdown was 60.6% female, 36.7% male, 1.9% non-binary, and 0.8% transgender.
Usage and Attribution
You are welcome to use the data and visual materials from this article for non-commercial purposes. Please credit the original source by linking back to this page if you share or repurpose these findings.